Blur
Gaussian, motion, defocus, glass, zoom.
ICML 2026 · vision-language robustness
A comprehensive benchmark for robustness of vision-language models.
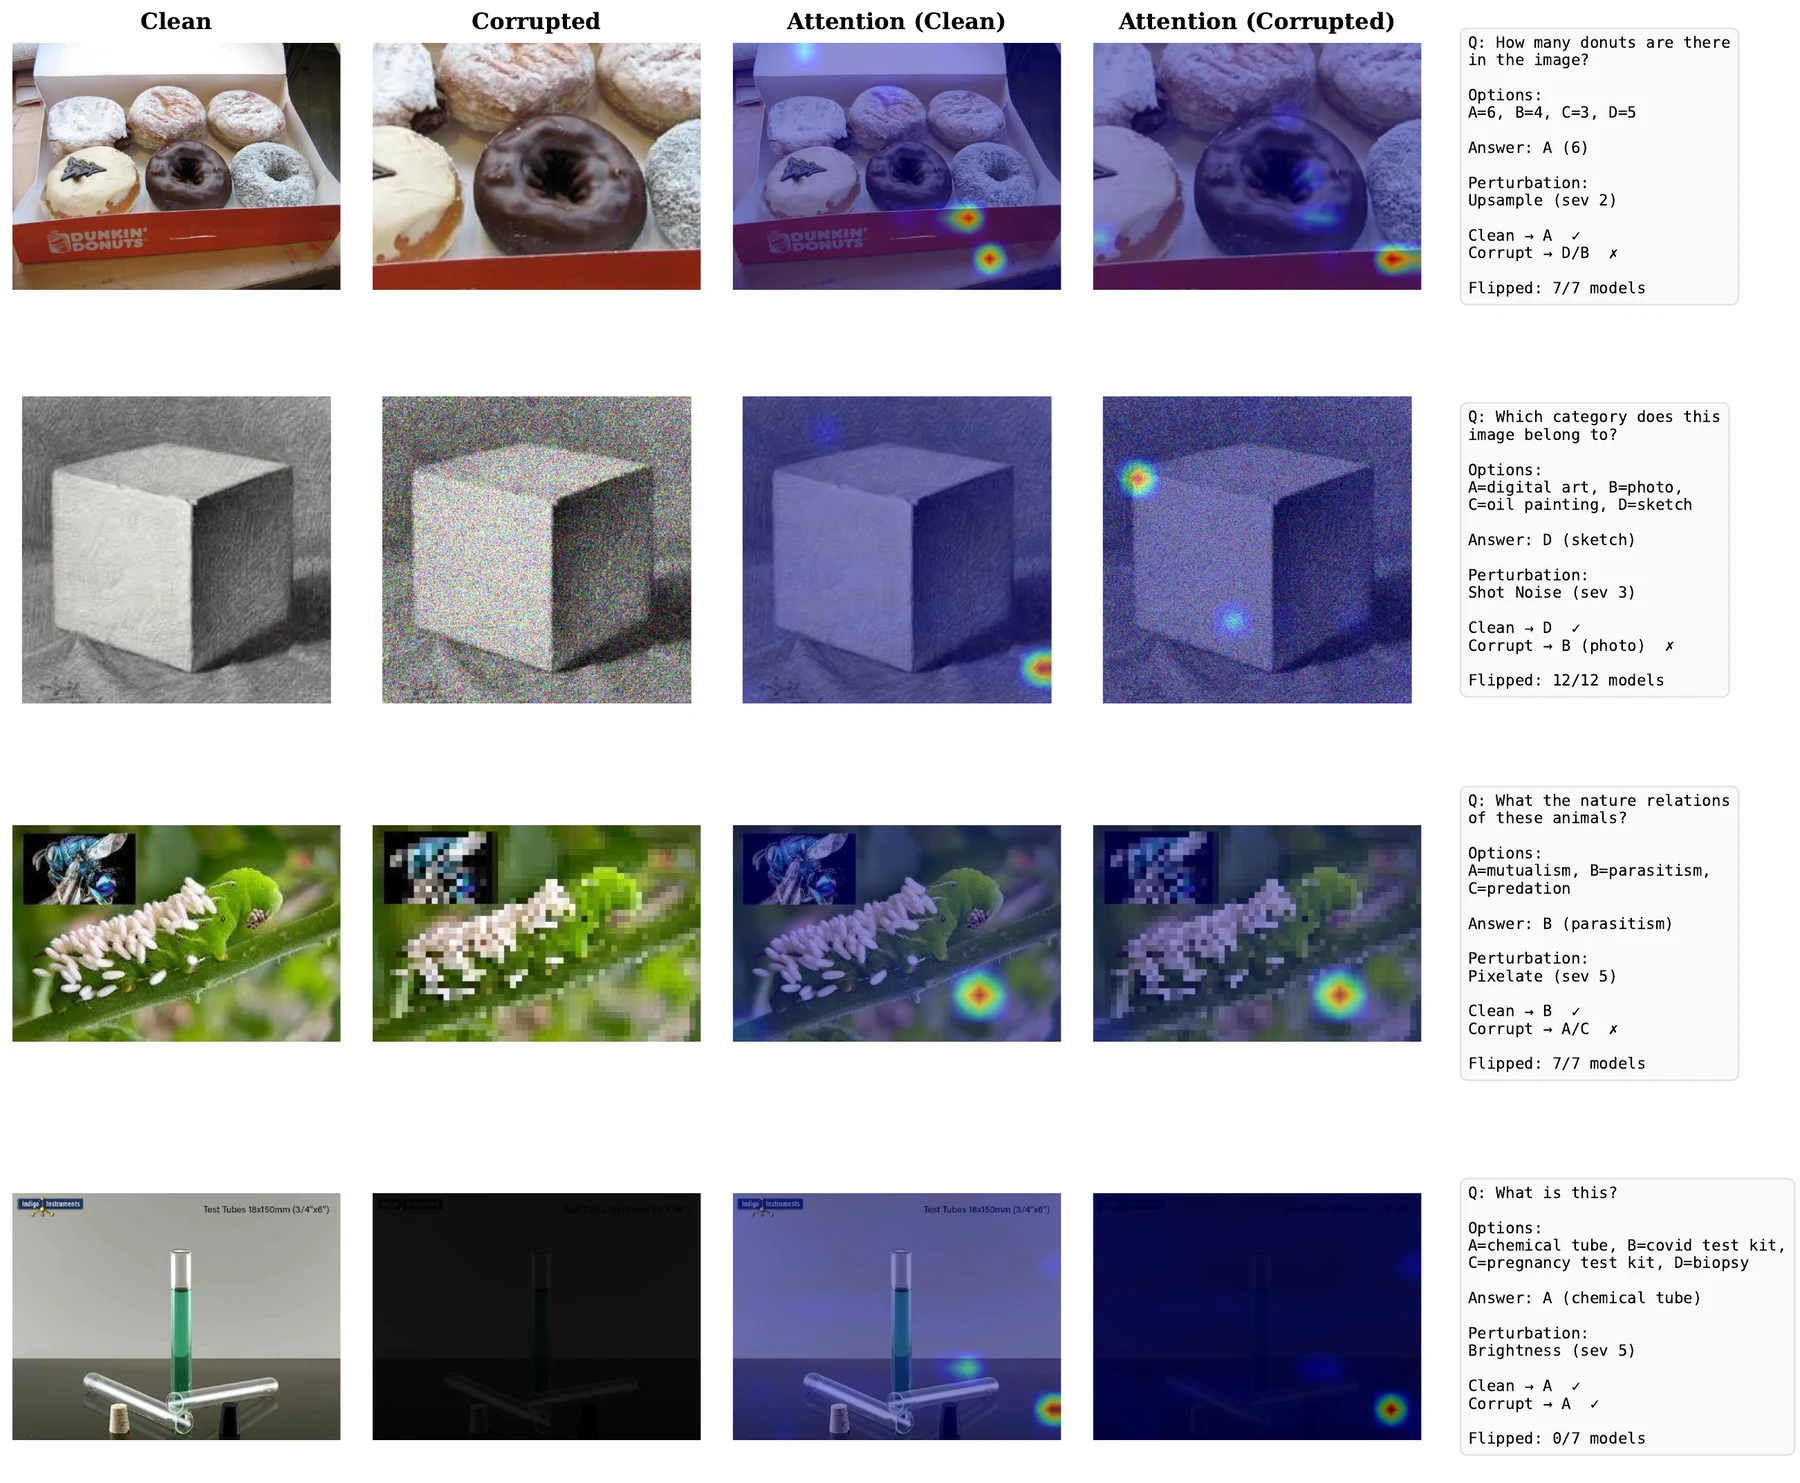
We evaluate modern VLMs under realistic visual corruptions and find a consistent pattern: current models are semantically strong, but spatially fragile.
University of Edinburgh · Miniml.AI
Benchmark design
VLM-RobustBench applies 42 severity-based corruptions at low, mid, and high levels, plus 7 binary transforms, to MMBench and MMMU-Pro. The evaluation keeps prompts and answer formats fixed so drops isolate visual robustness.
Gaussian, motion, defocus, glass, zoom.
Gaussian, shot, speckle, salt and pepper.
Fog, frost, snow, rain, spatter.
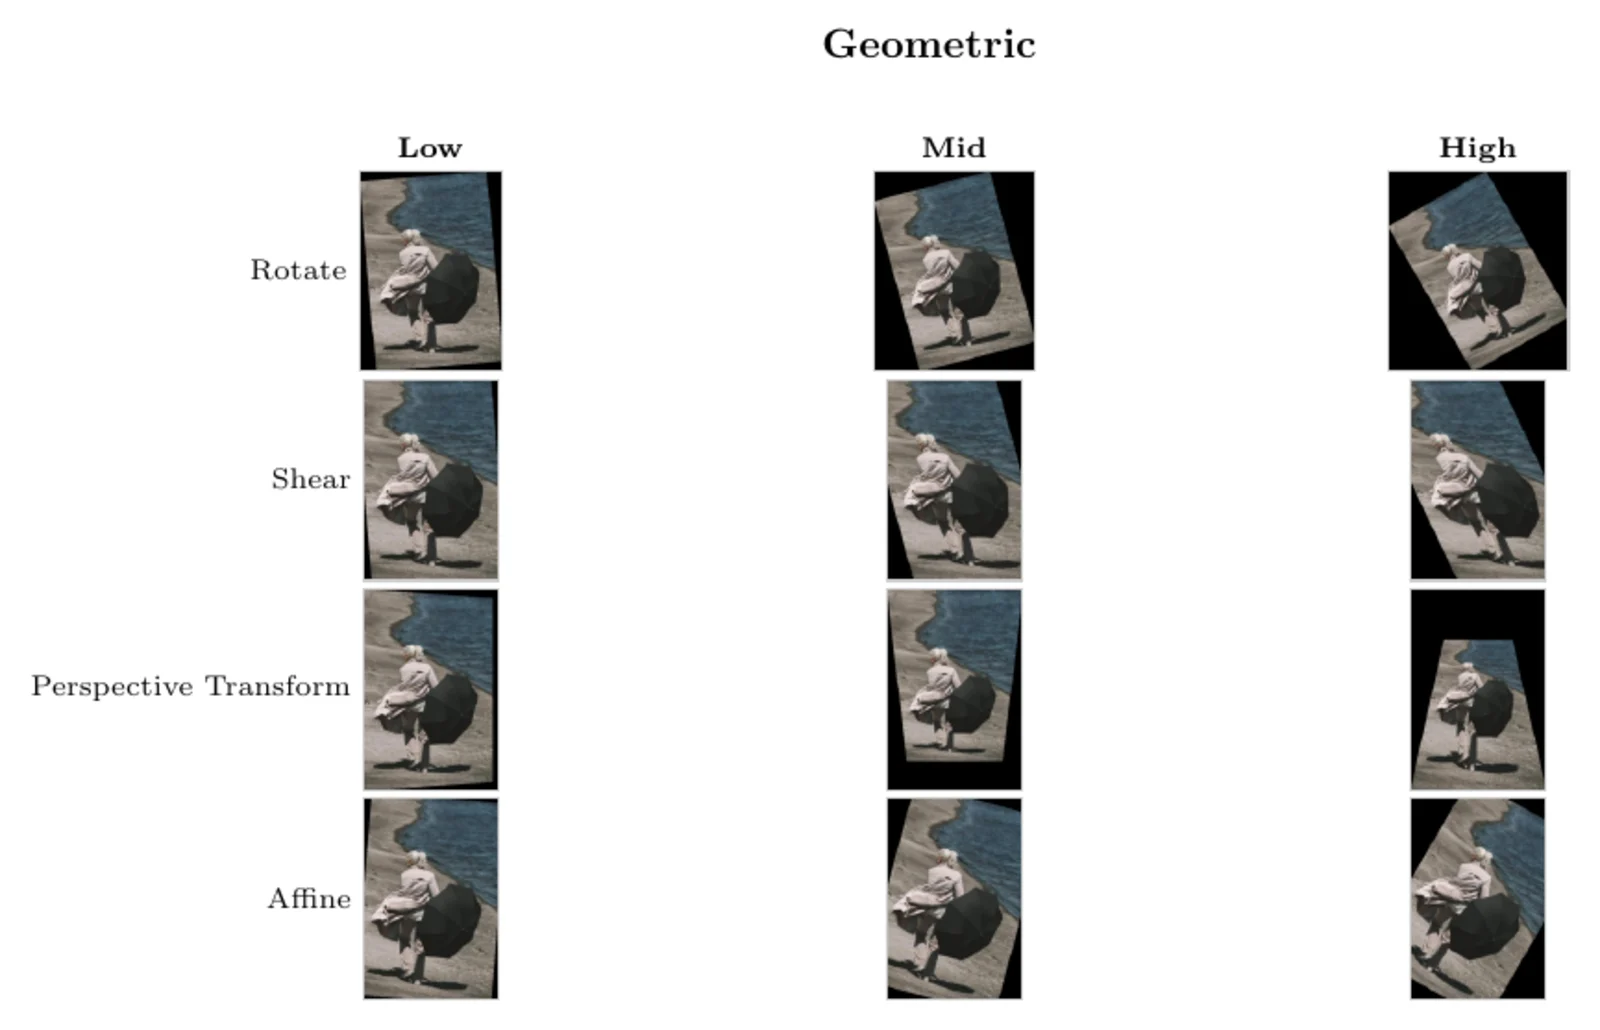
Rotation, shear, perspective, elastic transforms.
Downsample, upsample, sharpen, posterize, solarize.
Flips, grayscale, invert, channel swap, equalize.
The suite covers photometric degradation, spatial warping, resampling artifacts, occlusion, and VLM-specific overlays.
Interactive results
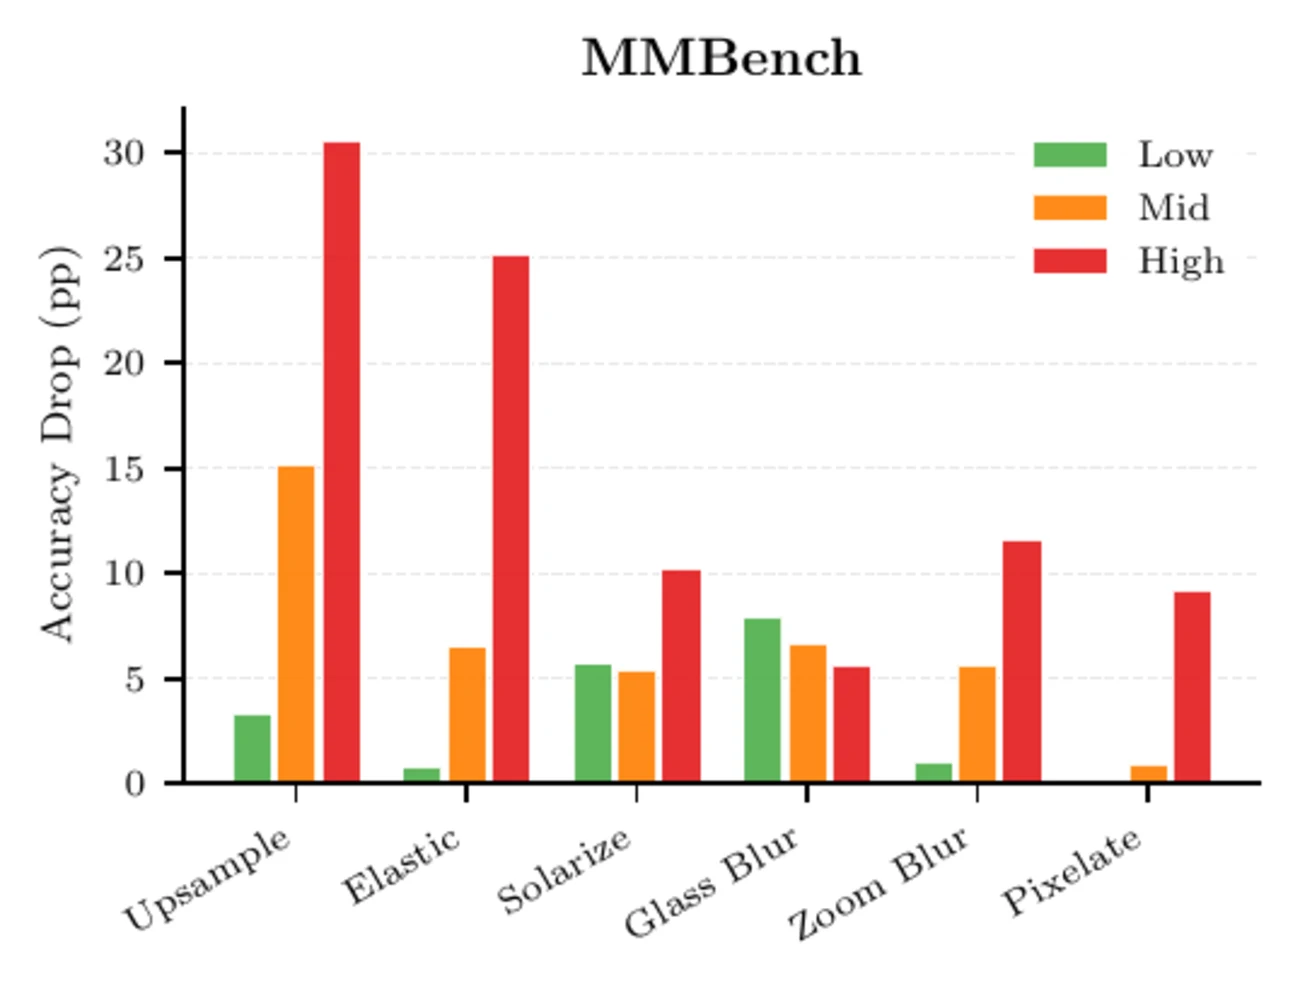
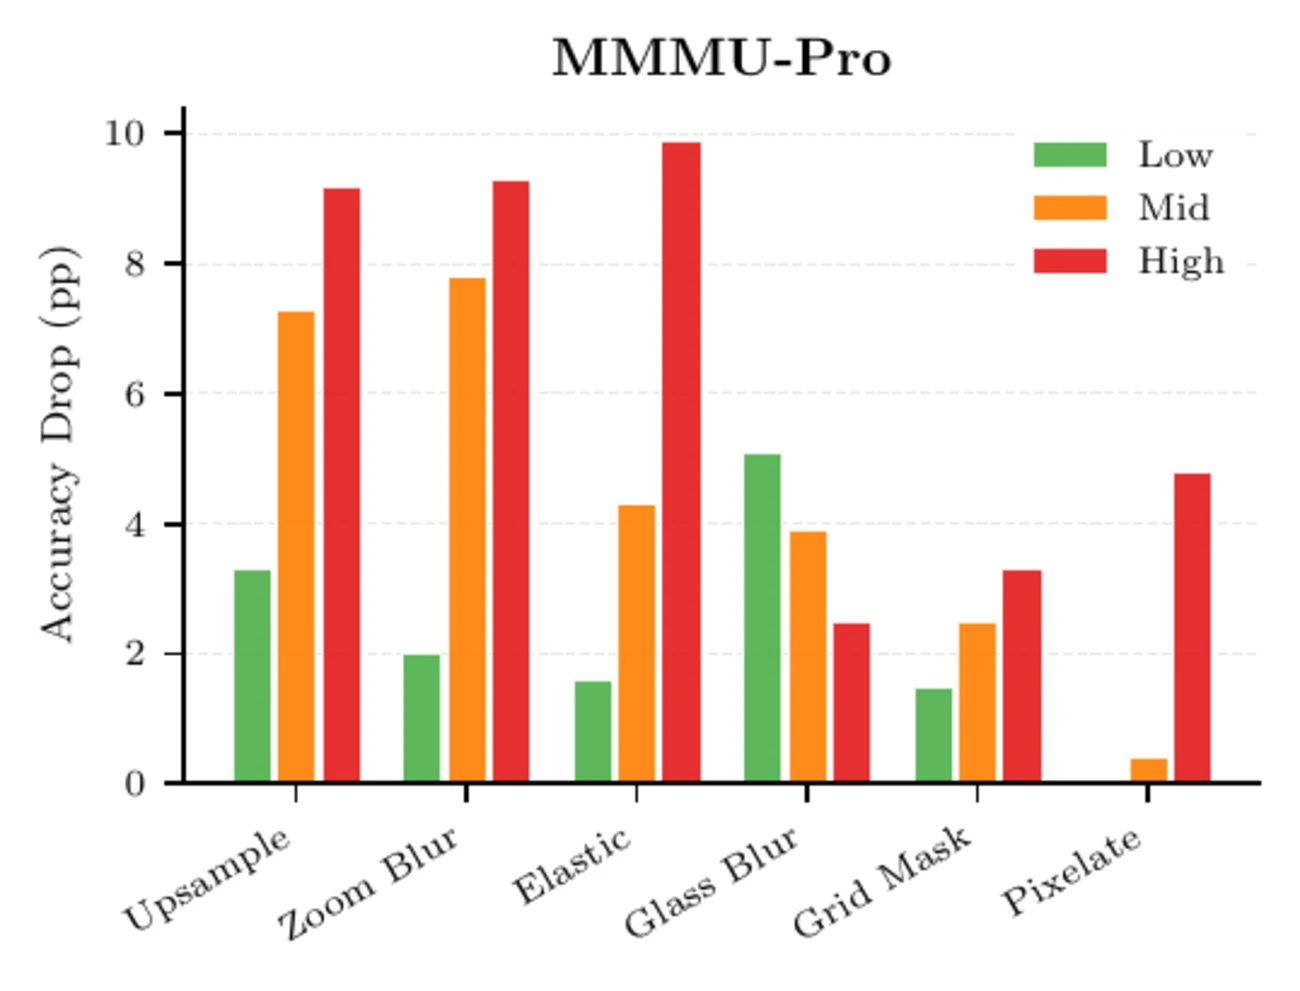
Explore the main robustness table across MMBench and MMMU-Pro. Worst-case drops reach 34 percentage points on MMBench, with upsampling as the dominant failure mode.
Higher is better.
Bubble size tracks visual gain.
Lower is better; 100 matches the dataset reference.
Family-level mean drops on MMBench.
Failure modes
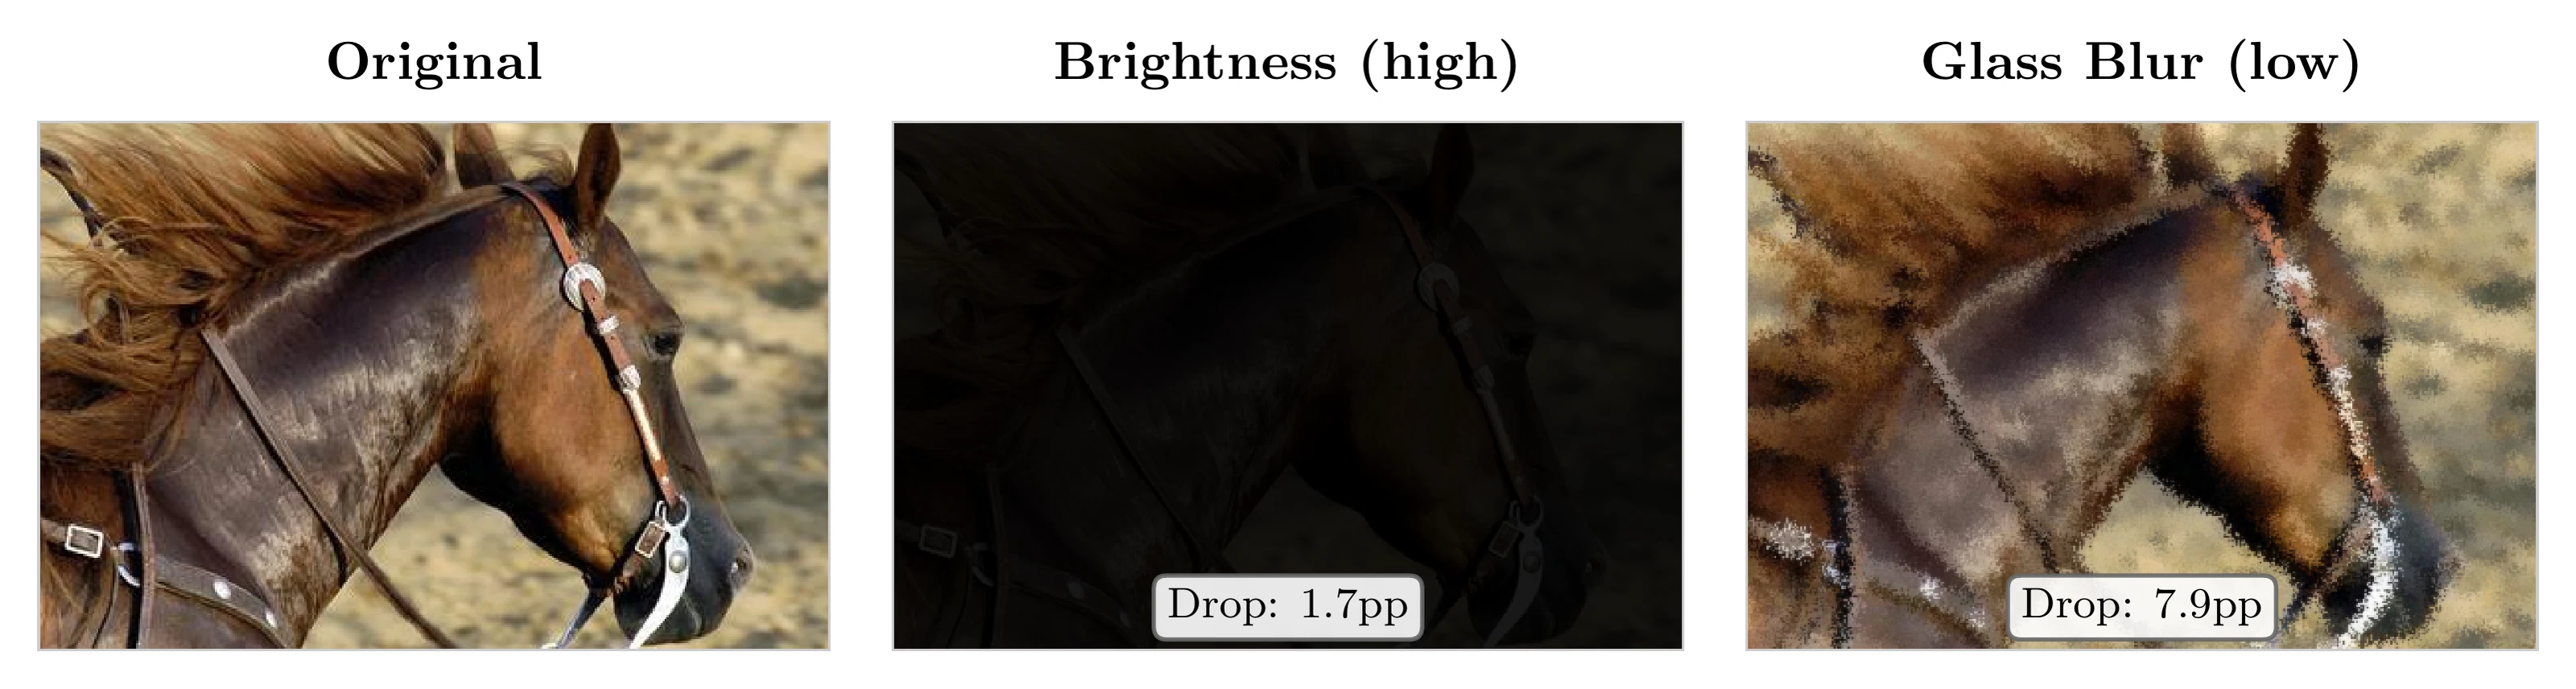
Low-severity glass blur reduces MMBench accuracy by about 8 points on average, while high-severity brightness reduction costs only about 2 points. This breaks the usual assumption that visual severity is a reliable proxy for model difficulty.
Harmful flips are correct-to-wrong transitions.
Counts over corruption configurations and models.
Worst drop by MMBench category or MMMU-Pro domain.
Top corruptions by lost visual contribution.
Upsampling and elastic transforms drive the largest drops, reaching up to 34 points.
Violation rates are 30.2% on MMBench and 56.1% on MMMU-Pro.
Robustness is not explained by parameter count alone; families fail differently.
Citation
@inproceedings{saxena2026vlmrobustbench,
  title = {VLM-RobustBench: A Comprehensive Benchmark for Robustness of Vision-Language Models},
  author = {Saxena, Rohit and Suglia, Alessandro and Minervini, Pasquale},
  booktitle = {Proceedings of the International Conference on Machine Learning (ICML)},
  year = {2026}
}